时间价值图
1.什么是时间价值图
时间价值图(Time Value Map)是一种用时间表达的特殊价值图。是6西格玛方法中的一种工具。
2.时间价值图的作用
⑴以具体的图象说明流程中机智与非价值时间;
⑵相较于价值图,时间价值图更能掌握整体周期时间。
3.如何绘制时间价值图
⑴判定流程周期时间;
⑵判定步骤之间的等候时间(延迟)及执行每项工作所需的价值时间;
⑶画出一个时间轴,并将总流程时间等分成单位时间;
⑷将流程中的步骤与延迟依发生顺序标示在图上,并以不同的区块标示时间;
⑸画出反馈的循环(Feedback Loop),并标出输出百分比(Yield Percentage);
⑹价值所使用的时间。
4.A Note About Waste in Project Management
One of the primary goals of the Lean Six Sigma project management methodology is the elimination and reduction of waste. There are different types of waste in the Six Sigma terminology. These seven types of waste are:
- Overproduction - occurs when a product is made without a buyer
- Waiting - occurs when a product sits in waiting for processing
- Transport - occurs when a product is moved to many different places
- Inventory - occurs when a product is stored and it costs money
- Over-processing - occurs when a step in the process is unnecessary or redundant
- Motion - occurs when people move excessively
- Defects - occurs when an error in the process occurs
Companies that wish to save money and resources do well to reduce waste in their processes. The reason a time value map is so crucial to project management is that it allows identification of areas of waste.
5.时间价值图案例
案例:资金时间价值图
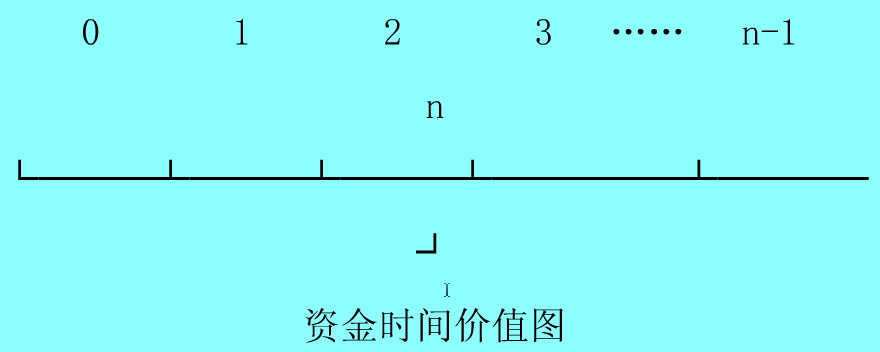
如果时间价值以年表示,则“0”表示第一年初这一时间点;“1”表示第一年年末这一时间点,或表示第二年年初这一时间点;依此类推,一直到“n”,即“n”表示第n年年末这一时间点,或表示第(n+1)年年初这一时间点。在0和1之间的数轴表示第一年这一时间段;依此类推,在(n-1)和n之间的数轴表示第n年这一时间段。在时间点上发生的现金流量,如果是现金流出量,用负数或(数值)表示;如果是现金流入量,用正数表示。